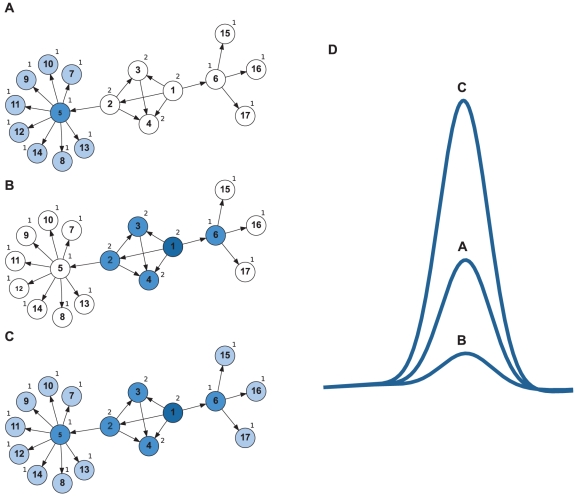
Figure 3. Interplay between node properties and higher-order network features.
Example of a toy-network illustrating that the degree to which any given metric of neuron embeddedness predicts the neurons' impact on the population response may depend on single neuron properties. The small numbers next to each node indicate the corresponding k-shell-out index. (A,B) Neurons exhibited regular firing behavior. (A) A sufficiently strong input activating neuron 5 will yield propagation of activity to neurons 7–14. (B) If the same stimulus arrives in neuron 1, activity will only spread to neurons 2–4 and 6. In this case, the out-degree correctly predicts that the impact of neuron 5 is bigger than that of neuron 1. (C) Neurons exhibited bursting behavior. As previously, neuron 1 will activate neurons 2–4 and 6. However, the bursting response of these neurons may be sufficient to activate their post-synaptic targets as well, leading to spreading of activity over the entire network. Here, the impact of neuron 1 is clearly larger than that of neuron 5. This effect is not grasped by the widely used out-degree measure. However, higher-order network metrics, like the k-shell-out index, correctly assign a higher value to neuron 1, as compared to neuron 5. (D) Total network response in the three cases depicted in panels A–C. Note the higher impact of neuron 1 under some conditions (curve C), compared to that of neuron 5 (curve A).

