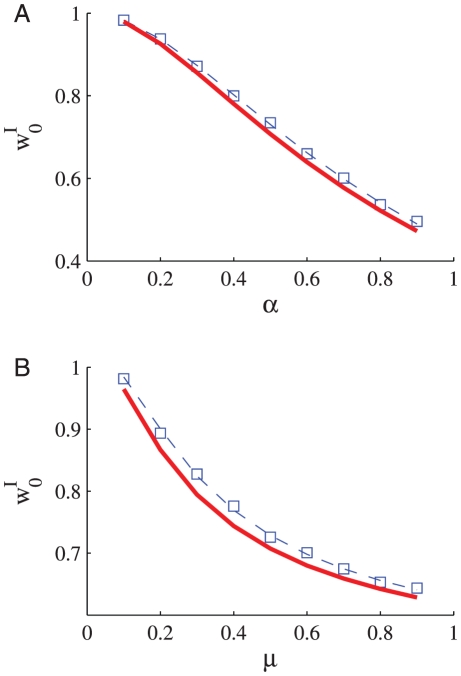
Figure 4.
The asymptotic synaptic weight,  , in learning dynamics of a single inhibitory synapse is shown as a function of A the ratio between potentiation and depression,
  (for
(for  ) B the parameter
  (for
(for  ). The open blue squares show the results obtained in simulating the stochastic learning dynamics using an integrate and fire postsynaptic neuron (see Methods). The solid red line shows the fixed point of equation (14), calculated using the function
  that was obtained from the fit to the spike triggered average, Figure 2. The dashed blue line shows the fixed point solution to equation (14) using a value for
  that was optimized to best fit the simulation results.

