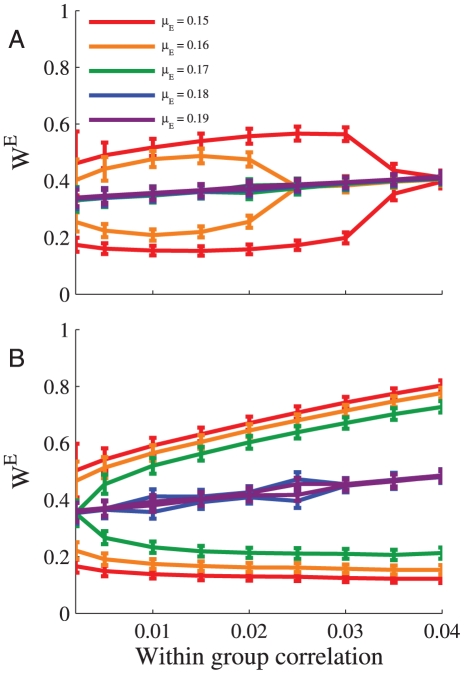
Figure 10. Sensitivity of excitatory plasticity.
The learning dynamics of a population of  inhibitory and
  excitatory presynaptic neurons was simulated. The firing rate statistics of the presynaptic neurons followed Poisson process statistics with a mean rate of
  spikes/s. The inhibitory population was homogeneous and without correlations. The excitatory population was composed of two subgroups of equal size with a uniform correlation coefficient within each group,
  , and a zero correlation coefficient between cell pairs from different subgroups (see Methods). The figure shows the mean synaptic weight of each excitatory subgroup (
 standard deviation) at the end of the learning process, as a function of the within-group correlation strength for different values of
  . A Without inhibition,
  . B With learning of a homogenous population of
  inhibitory synapses. Here we used
  ,
,  ,
,  , and
, and  . The points on the graph represents the mean over the last 600 minutes, simulation time was 2400 minutes.

