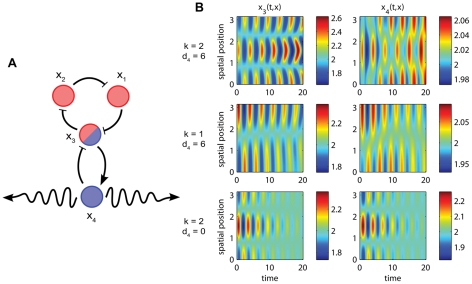
Figure 2. PDE simulation results for the toy model.
The system (1) run with parameters  ,
,  ,
,  ,
,  , and
, and  . Position, time, and concentrations are scaled to be dimensionless. See Figures S1, S2 for full simulation results. (A) Toy model network with labeled species. Coloring scheme for loops follows that of Figure 1B. (B) With
  , Turing instability conditions are met for a slight perturbation of the homogeneous initial condition with the second wave (
 ), and growth of the inhomogeneity follows (top row). Solution
  looks qualitatively different than
  and the other species due to the “bleeding” effect of diffusion. With
  , Turing instability conditions are not met for
  and the initial inhomogeneity decays slowly in time (middle row). With
  , the initial inhomogeneity
  decays in time (bottom row).

