
Figure 6. Results and analysis of PDE simulation for Parameter Set 2.
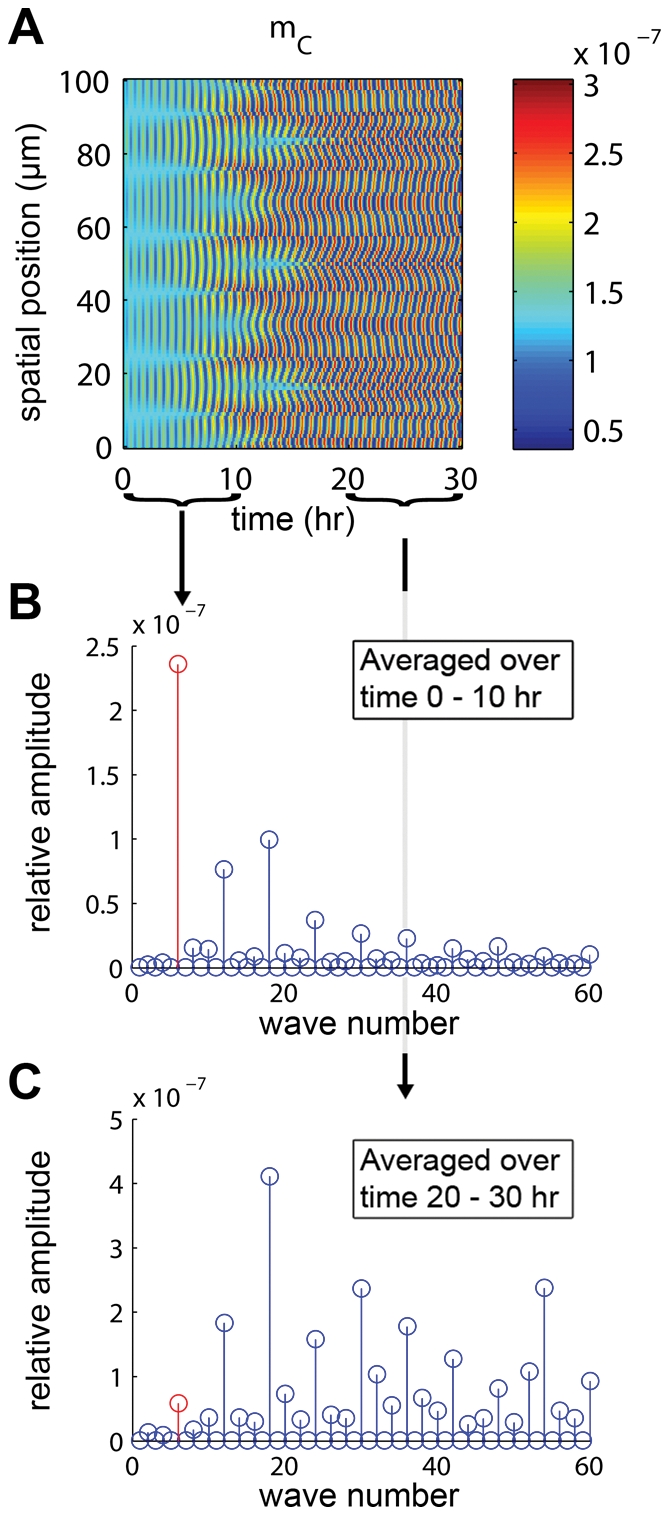
(A) PDE simulation results for  cI mRNA using Parameter Set 2 in Table S1 to draw comparisons between parameter sets (Figure 4B). Concentrations (colorbar) given in
  . The imprinted wave
  was chosen because it falls above the minimum unstable wave number of
  for this parameter set (
 ). Parameter Set 2 oscillates much faster than Parameter Set 1, and because of this we observe more interesting behavior within the 30-hr simulation window once the oscillations reach their maximum amplitude. In particular, the imprint initially grows, but then the energy moves into higher harmonics as time goes on. See Figure S6 for full simulation results. (B) Discrete cosine transform (DCT) of
  cI mRNA over the window of 0–10 hr. The imprinted wave (shown in red) dominates and grows. (C) Over the window 20–30 hr, higher harmonics have begun to dominate.