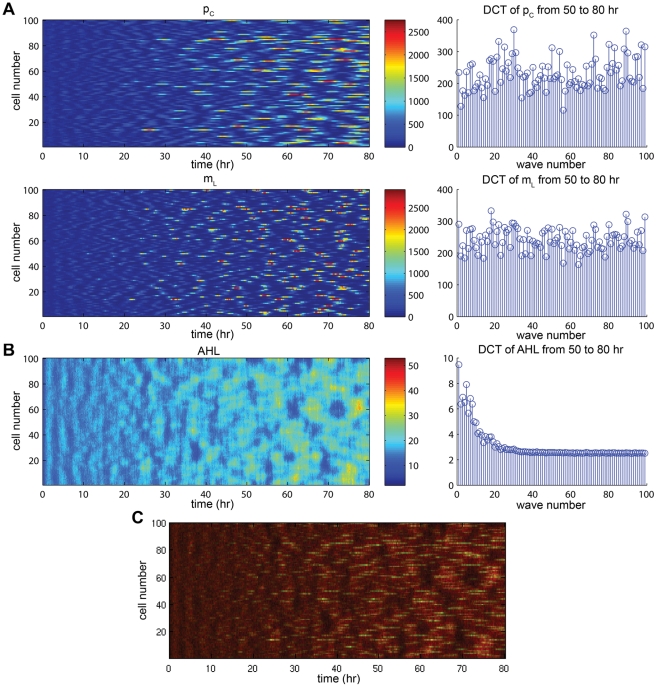
Figure 8. Representative sample of stochastic simulation results for a line of cells with homogeneous initial condition.
Included are color plots (left) and DCTs averaged over hours 50 to 80 (right). The stochasticity causes oscillations to arise naturally and can be seen as early as hour 20. See Figures S11, S12 for full simulation results. (A) Results for  (top) and
  (bottom) are indicative of the behavior for mRNA and proteins for
  cI, TetR, LacI, and LuxI. While the DCT plots vary from species to species, certain wave numbers are found to be more pronounced across all species, particularly
  . (B) Results for AHL produce similar behavior in all downstream species in the quenching loop. Both the color plot and DCT are markedly different due to the effects of diffusion, which causes a “spreading” of the rapid peaks seen in mRNA and protein color plots and acts like a low-pass filter in the frequency domain. (C) Overlay plot of AHL and
  demonstrating the correspondence between the peaks in the species as well as the effect of diffusion. AHL was monochromed in red and
  in green, leading to the appearance of yellow in areas of large overlap.

