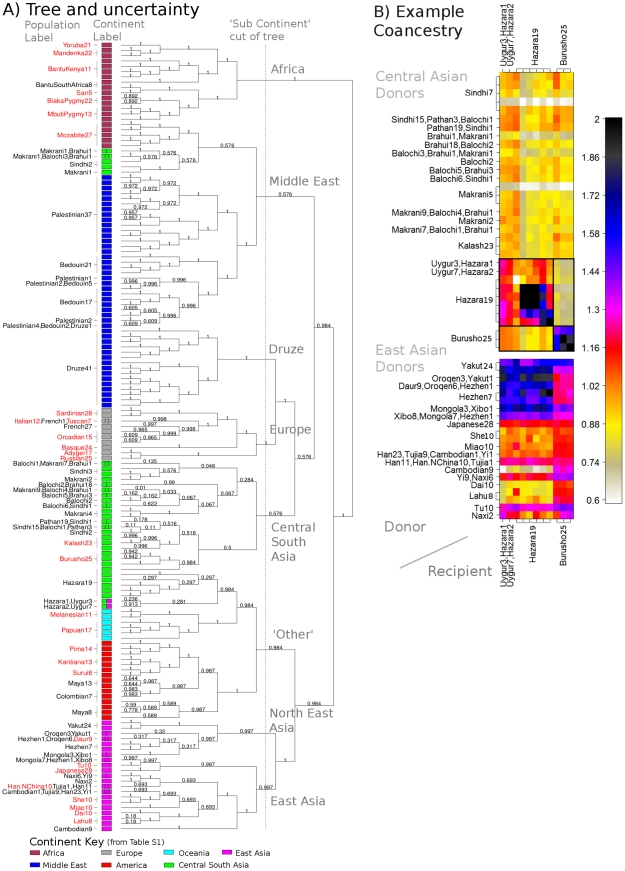
Figure 4. World HGDP results summary.
A) Relationship between populations for the whole world data. Each tip corresponds to a population; labels include the number of individuals and are coloured red if all individuals within that label are found in a single clade. See text for an interpretation of the values on the edges; the cut defines the ‘sub-continents’ discussed in the text. B) Transposed coancestry matrix for the Hazara and Burusho (in full: Figure S14), showing CentralSouthAsia and EastAsia donors, which are each normalised to have mean donation rate of 1. The box shows the ‘diagonal’ drift component.

