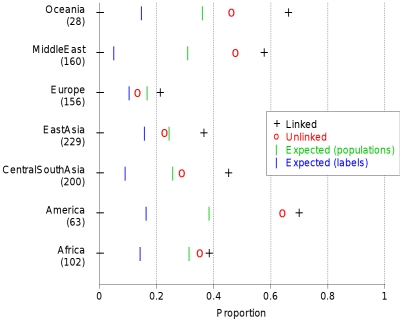
Figure 7. Half-matching using correlations for HGDP data.
For each continent, we show the proportion of times in which two sets of chromosomes of a particular individual are matched correctly based on similarity of their coancestry profile. Coancestry profiles are calculated using a training set as described in the text. Results for coancestry matrices are calculated using correlation between individuals based on the linked and unlinked models. Also shown are the expected success in clustering if individuals within the same label or same inferred (linked results) fineSTRUCTURE population each had the same ancestry profile.

