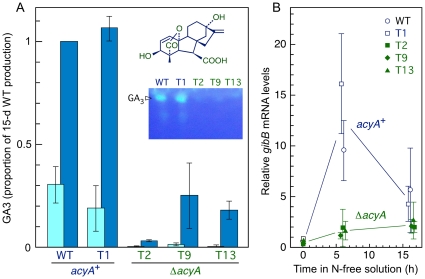
Figure 6. Production of gibberellins by the acyA + and ΔacyA strains.
A: Relative GA3 contents in the filtrates of the cultures of the indicated strains after 9 days (pale front bars) and 15 days (dark back bars) incubation in low nitrogen broth in the dark. The data show average and standard deviation from two independent experiments. Inner picture: TLC separation of gibberellin samples from the five strains in a representative experiment. The fluorescent spot is GA3 (chemical formula shown above). B: Quantitative RT-PCR analyses of gibB mRNA levels in the five strains grown in high nitrogen medium for 3 days and incubated afterwards in 2 g l−1 glucose for the time indicated in abscissas.

