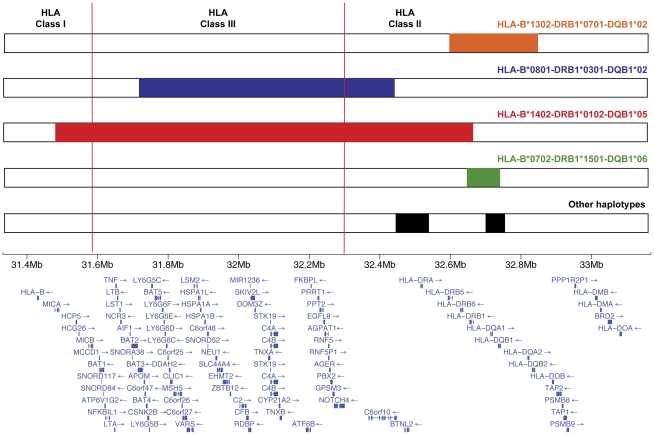
Figure 4. Summary of most significant independent association signals in the HLA locus.
For each conserved haplotype background the critical region where the putative causal variant is more likely to be located is highlighted. Genomic positions on the x-axis are based on the NCBI Build 36 (hg 18) assembly. Mb, megabase pairs.

