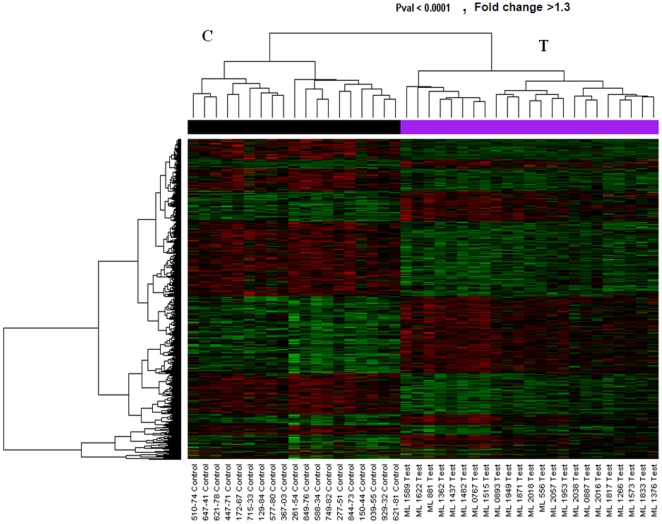
Figure 1. Heatmap of representative genes from a sample of HIV-1 highly exposed uninfected sex workers (Test) and susceptible HIV negative controls (control) evaluated through unsupervised hierarchical clustering algorithm.
Each row on the Y axis represents a single gene probe and the phylograms represent distinct signaling pathways. The red color denotes up regulated genes while the green are down regulated.

