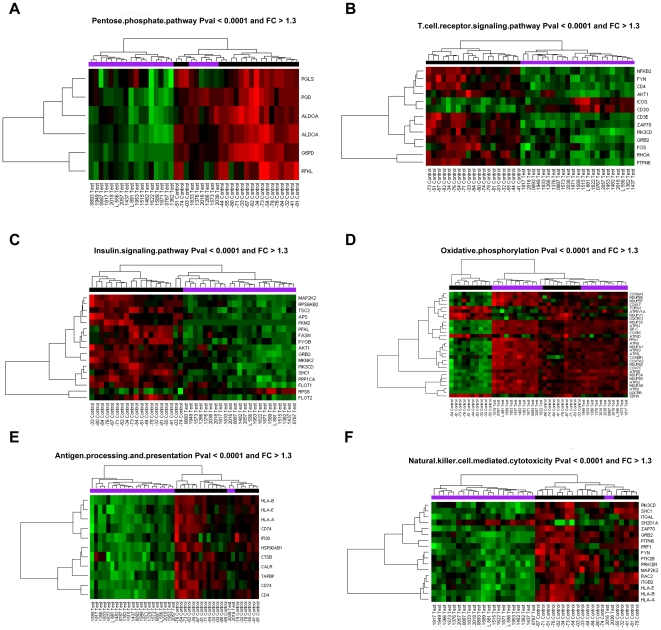
Figure 3. Heatmaps of the most differentially regulated signaling pathways among the HIV -1 highly exposed (Test) and HIV negatives (Control).
Figure 3a -Pentose phosphate pathway; b) T cell receptor signaling; c) Insulin signaling, d) Oxidative phosphorylation, f) antigen processing and presentation, g) Natural Killer cell cytotoxicity. FC -fold change. Each row on the Y axis represents a single gene probe and the phylograms represent distinct signaling pathways. The red color denotes up regulated genes while the green are down regulated.

