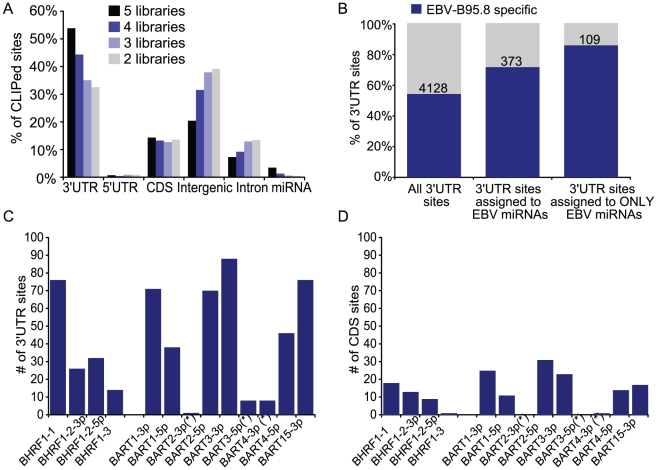
Figure 2. Distribution of PAR-CLIP Clusters reveals 3′UTR bias.
A. Overlap of clusters in the five PAR-CLIP libraries. Shown is the breakdown of clusters mapping to 3′UTRs, 5′UTRs, coding regions (CDS), intergenic regions, introns, and mature miRNAs. Clusters from separate libraries were considered overlapping if, based on genome coordinates, they shared >50% of their nucleotides. B. miRNA-interaction 3′UTR sites specific to EBV-infected LCLs. miRNA-interaction sites present in at least two of the five LCL PAR-CLIP libraries were compared to miRNA-interaction sites present in two EBV-negative PEL PAR-CLIP libraries. 109 sites in 3′UTRs contain seed matches to only EBV miRNAs and are highly specific to EBV-infected LCLs. C and D. Breakdown of 3′UTR (C) and CDS (D) sites assigned to individual EBV miRNAs.

