
FIGURE 1.
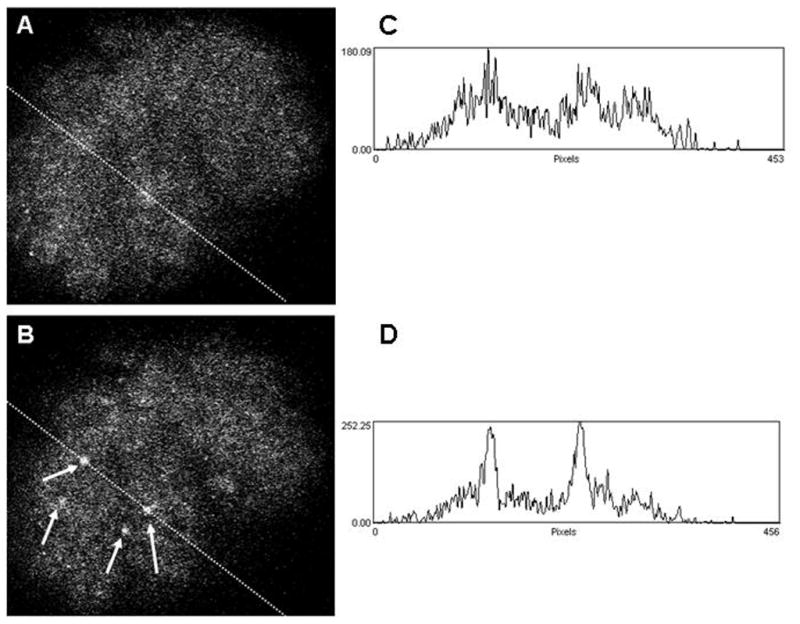
Confocal fluorimetric image of an isolated rat glomerulus loaded with fluo-4 before [A] and after [B] administering endothelin-1 (100 nM). Arrows in B indicate cells which have responded to the applied agonist. Corresponding plots of pixel intensities along a slice through the glomerulus are given in C and D.