
FIGURE 2.
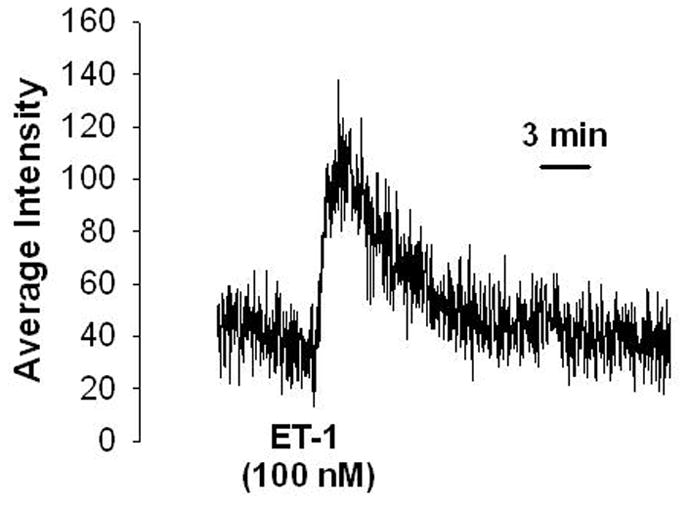
Typical tracing showing change in [Ca2+]i concentrations as increase in average fluorescence intensity in response to endothelin-1 (ET-1) in the glomerular cells. Fluorescence intensities were saved and plotted againsttime. An increase in fluorescence was interpreted as an increase in [Ca2+]i.