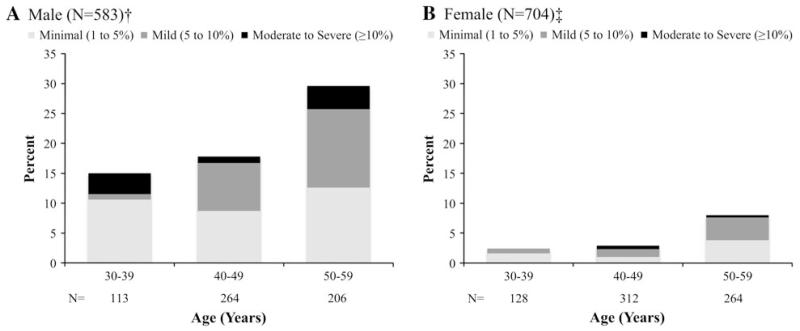
Figure 1.
Prevalence of inducible ischemia and ischemia severity (based as measured by 17-segment semi-quantitative analysis [none (0%), minimal (1% to 5%), mild (5% to 10%), moderate (10% to 15%), and severe (≥15%)]) by sex and age group. A Male (N = 583), P = .002 for the presence of ischemia across age decade and B female (N = 704), P = .008 for the presence of ischemia across age decade.

