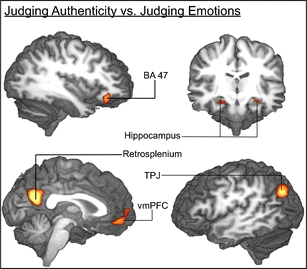
Fig. 5.

Brain activation correlates of experimental tasks. Group-averaged (n = 24) statistical maps of significantly activated areas for authenticity versus emotion judgment trials. To correct for false-positive results, a voxel-wise z-threshold was set to Z = 2.33 (p = .01) with a minimum activation area of 270 mm3 and was mapped onto the best average subject 3-D anatomical map. Top left: right view sagittal section through temporal lobe. Top right: anterior view coronal section through thalamus. Bottom left: right view through corpus callosum. Bottom right: left view sagittal section through temporal cortex. TPJ temporoparietal junction; vmPFC ventromedial prefrontal cortex
