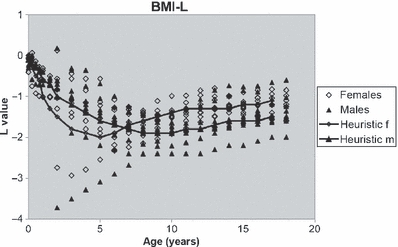
Figure 2.

Published L-values of the Belgian (9), the UK (8,15,16), the Italian (17) and the WHO references, and studies published in the Netherlands (24), Germany (25), Sweden (26) and Brazil (27). The obvious differences in L are not explicable by particular features of the populations. Through lines indicate heuristic reasonable choices of L-values (Table 1).
