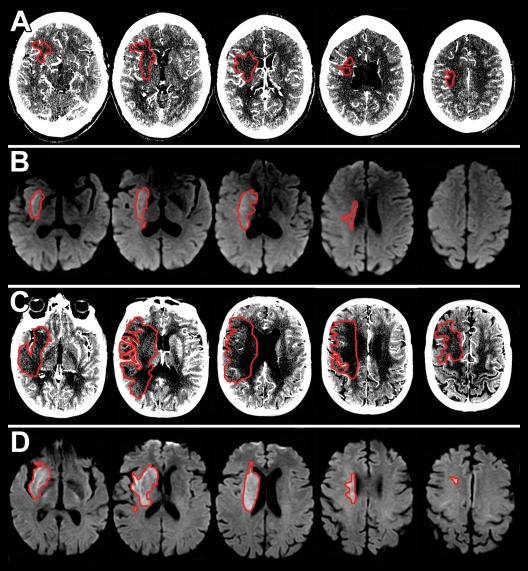
Figure 2:
Axial, A, C, CT angiography source images and, B, D, DW images. Ischemic lesions are outlined in red. A, B, Images in 65-year-old woman with NIHSSS of 16 and right ICA and MCA M1 occlusion imaged with protocol 1. A, CT angiography source images were acquired 5 hours 20 minutes after symptom onset, and, B, DW images were acquired 20 minutes after the CT examination. The hypoattenuating area in A (13.1 mL) matches the area of decreased diffusion in B (15.2 mL). C, D, Images in 66-year-old woman with NIHSSS of 16 and right MCA M1 occlusion imaged with protocol 2. C, CT angiography source images were acquired 4 hours 30 minutes after symptom onset, and, D, DW images were acquired 23 minutes after the CT examination. The hypoattenuating area in C (159.5 mL) is much larger than the lesion in D (25.3 mL).

