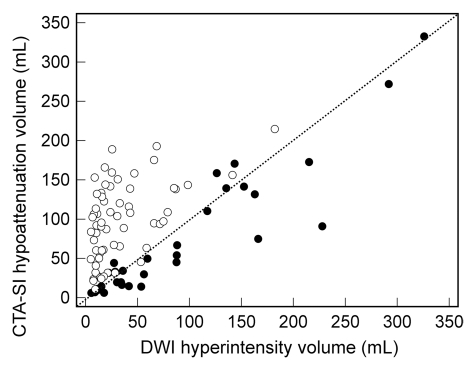
Figure 3a:
(a) Scatterplot shows correlation between infarct volume on CT angiography source images (CTA-SI) and that on DW images (DWI) for protocol 1 (●) (ρ = 0.912) and protocol 2 (○) (ρ = 0.494). (b) Bland-Altman plot shows agreement between infarct volume on CT angiography source images and that on DW images for protocol 1 (●) (mean, 0.82) and protocol 2 (○) (mean, 5.0). Dotted line = line of equality.

