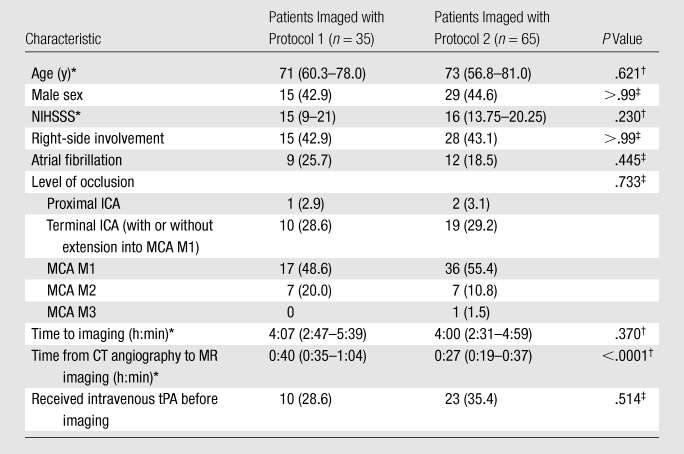
Table 3.
Comparison of Clinical and Demographic Characteristics between Patients Imaged with Protocol 1 and Those Imaged with Protocol 2

Note.—Unless otherwise indicated, data are numbers of patients, with percentages in parentheses. NIHSSS = National Institutes of Health Stroke Scale Score.
Data are medians, with IQRs in parentheses.
Calculated with the Mann-Whitney U test.
Calculated with the Fisher exact test.
