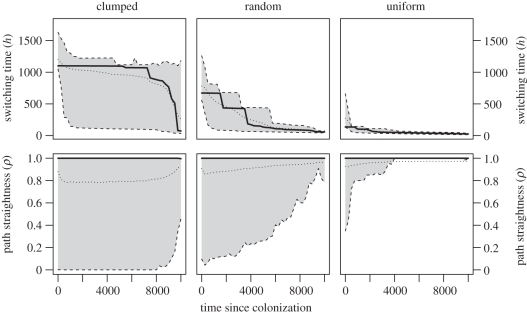
Figure 4.
The change in movement behaviour traits since patch colonization through time, in three types of landscape. The bias shape was fixed at s = 25. The shaded area and dashed line encloses 95% of values; thick lines are medians and dotted lines are means. Values are averaged over 25 simulations. Changes in these traits related to the distance of a patch to expanding wavefront are shown in electronic supplementary material, figure S1, and a comparison with results with evolving switching shape in electronic supplementary material, figure S3.

