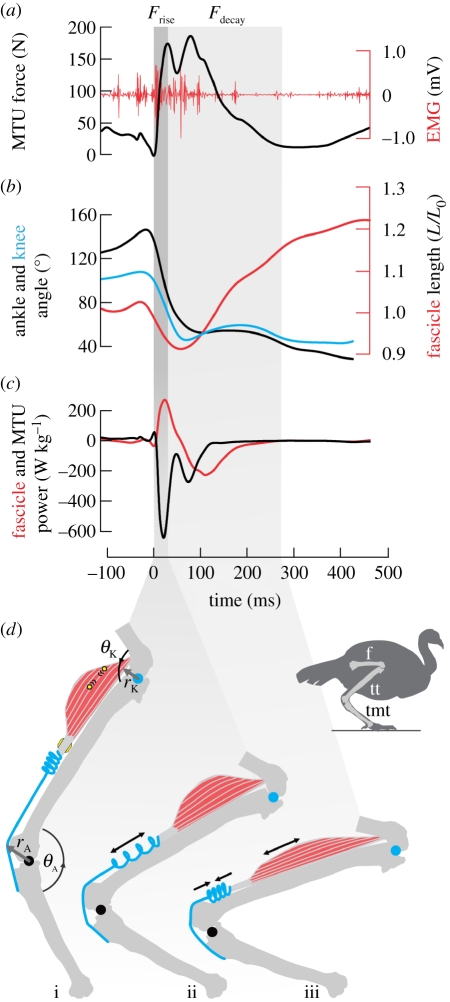
Figure 1.
Sample data and schematic of muscle-tendon unit (MTU) function during high-powered energy absorption. (a) Analysis was divided into a period of force rise (Frise, dark column), which was rapid, and force decay (Fdecay, light column), which occurred more slowly. (b) The majority of joint flexion occurred during Frise both at the ankle (black) and the knee (blue), while muscle fascicle lengthening (red, right axis, negative strain) typically occurred during Fdecay. (c) Power profiles of the MTU (black) and the fascicles (red) show that energy was initially absorbed by the MTU, while the rate of energy absorption by the muscle fascicles was lower and occurred later, during Fdecay. (d) A schematic of the pattern of tendon and muscle strain, as indicated by the sample data: joint flexion is accommodated by rapid tendon stretch during Frise (i–ii), followed by slower recoil of the tendon to lengthen muscle fascicles during Fdecay (ii–iii). We used direct measurements of muscle fascicle length via sonomicrometry (circles) and MTU force via strain gauges (quadrilaterals) on the calcified tendon (grey). MTU length was calculated from joint kinematics and muscle moment arms at the ankle (θA, rA) and knee (θK, rK). Bones: f, femur; tt, tibiotarsus; tmt, tarsometatarsus.

