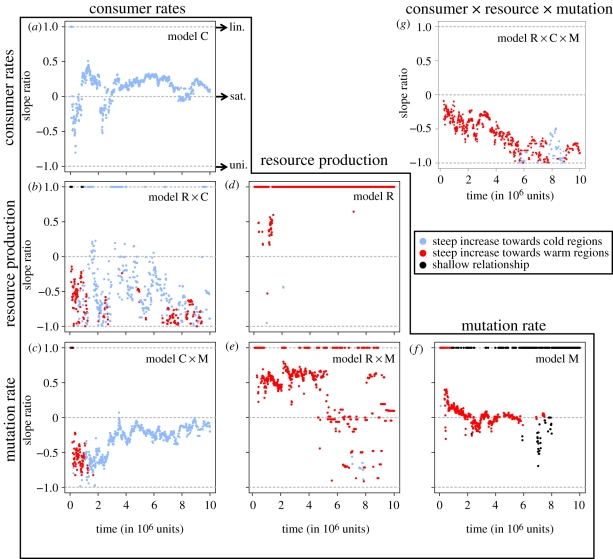
Figure 2.
Temporal dynamics of slope ratios from break-point regression of ln(diversity)-to-1/kT relationships across all combinations of thermal dependencies. Note that figure 1 shows the data and regression models underlying the slope ratios, but for only two points in time. The magnitude and colour of a given data point summarize the overall shape and direction of a temperature–diversity gradient at a given point in time under a given set of assumed thermal dependencies (refer to figure 1 and text for details). Abbreviations indicate ratio values for linear (lin.), saturating (sat.) and unimodal (uni.) relationships.

