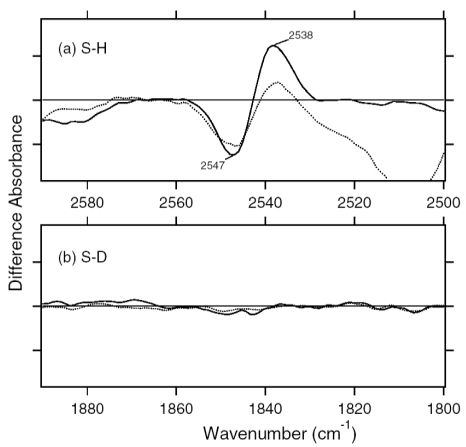
Figure 12.
The ASRK minus ASR spectra in the 2,590–2,500 cm-1 (the upper panel) and 1,890-1,800 cm-1 (the lower panel) region, which correspond to S-H and S-D stretching vibrations of cysteine residues, respectively. The sample was hydrated with H2O (solid lines) or D2O (dotted lines). One division of the y-axis corresponds to 0.0001 absorbance units. This figure is reprinted with permission from Furutani et al. [20]. Copyright 2005 American Chemical Society.

