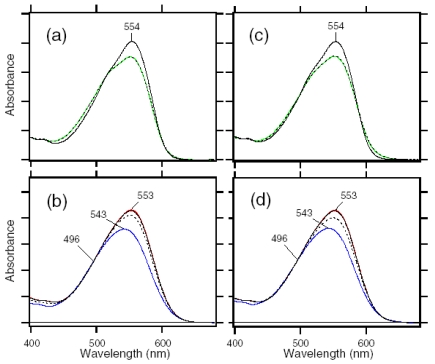
Figure 26.
(a) and (c). Absorption spectra of the dark-adapted ASR before (black solid lines) and after (black dotted lines) illuminations with >580 nm (a) or 501 nm (c) light at 170 K. Green lines represent the spectra reconstituted using those in Figure 24d. Under the present illumination conditions, 22 (± 2) and 32 (± 5)% portion were converted into the intermediates in a and c, respectively. (b) and (d). Black solid lines represent absorption spectra of the dark-adapted ASR at 277 K. Red and blue lines correspond to the calculated absorption spectra of ASRAT and ASR13C at 277 K, respectively, which were obtained from those of dark- and light-adapted ASR and the HPLC analysis [59]. Black dotted lines represent absorption spectra at 277 K after illuminations with >580 nm (b) or 501 nm (d) light at 170 K. Under the present illumination conditions, 23 (± 2) and 34 (± 4)% portion were converted from ASRAT to ASR13C at 277 K in b and d, respectively. From a-d, the branching ratio (x in Figure 22c) is obtained to be 1.02 ± 0.13 and 1.10 ± 0.09 for illuminations at >580 nm and 501 nm, respectively, indicating complete branching reactions from ASRAT for both illumination conditions. One division of the y-axis corresponds to 0.1 absorbance units. These figures are reprinted with permission from Kawanabe et al. [71]. Copyright 2007 American Chemical Society.

