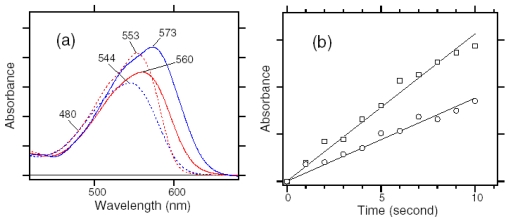
Figure 29.
(a). Red and blue broken lines correspond to the absorption spectra of ASRAT and ASR13C at 130 K, respectively, which were obtained from those of the dark- and light-adapted ASR and the HPLC analysis [59]. Isosbestic point is located at 480 nm. Red and blue solid lines represent absorption spectra of the K intermediates of ASRAT and ASR13C at 130 K, which were obtained according to the procedure in Figure 25. (b). Time-dependent absorbance changes of the dark-adapted (open circles) and light-adapted (open squares) ASR. Each sample was illuminated at the isosbestic point at 130 K (480 nm; a), and absorbance changes were monitored at 596 and 590 nm for the dark-adapted and light-adapted ASR, respectively. These figures are reprinted with permission from Kawanabe et al. [71]. Copyright 2007 American Chemical Society.

