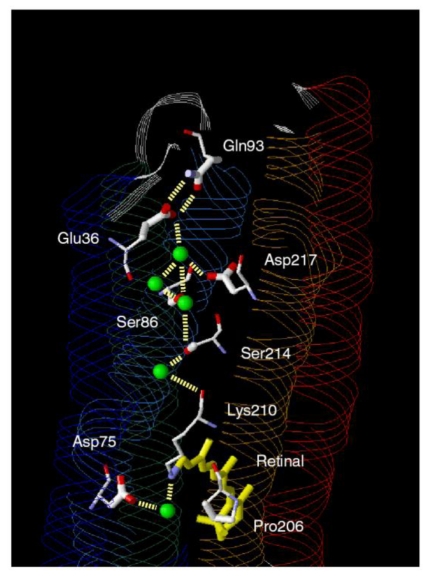
Figure 31.
X-ray crystallographic structure of the cytoplasmic region of ASR (PDB entry 1XIO [16]). Top and bottom regions correspond to the cytoplasmic surface and retinal binding pocket, respectively. Green spheres represent water molecules in the cytoplasmic region. Hydrogen-bonds (yellow dashed lines) are inferred from the structure. This figure is reprinted with permission from Kawanabe et al. [77]. Copyright 2008 American Chemical Society.

