
Fig. 1.
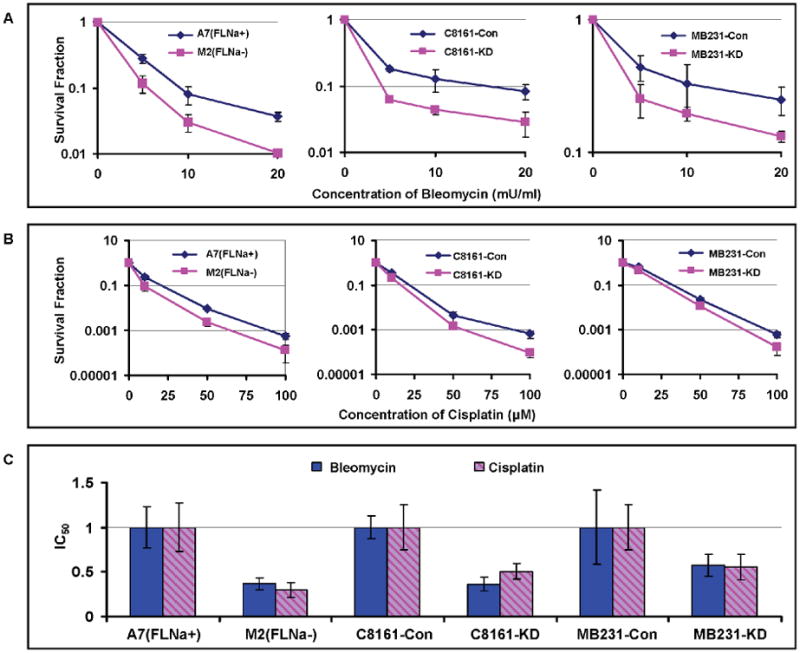
Sensitivities of filamin-A proficient and deficient cells to bleomycin and cisplatin. The following three pairs of isogenetic filamin-A proficient and deficient cell lines were used (see Material and Methods for details): M2 (FLNa-) and A7 (FLNa+); C8161-Con (filamin-A control) and C8161-KD (filamin-A knockdown); MB231-Con and MB231-KD. Panel A-B are the survival curves using colony formation assays (see Materials and Methods). Panel C shows the relative IC50 values of the filamin-A deficient cells normalized to that of the isogenic filamin-A proficient cells. The IC50 values were determined by growth inhibition assays (see Materials and Methods) and shown in Table 1. Error bars represent the standard deviation of at least three independent experiments.