
Fig. 6.
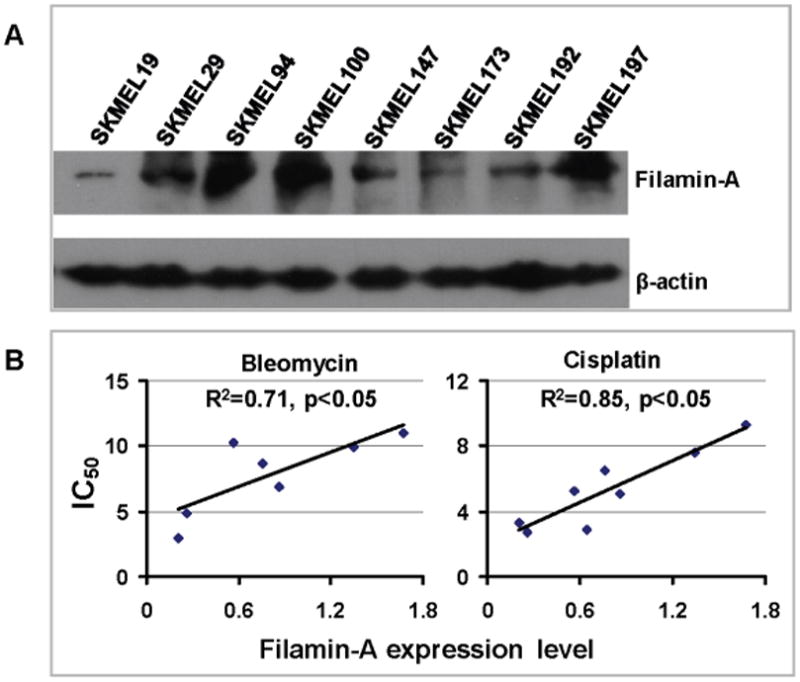
The level of filamin-A expression is correlated with drug sensitivity in melanoma cells. Panel A shows filamin-A expression in SKMEL cells as detected by Western-blot with whole cell extracts. β-actin re-detected from the same membrane and used as loading control to normalize the relative level of filamin-A expression. Panel B shows the plot of IC50 of each cell line against its filamin-A expression level (bleomycin treatment is on the left and cisplatin is the right). Linear regression analysis was performed using Microsoft Excel software and linear trend line is shown in scattering plot.