
FIGURE 2.
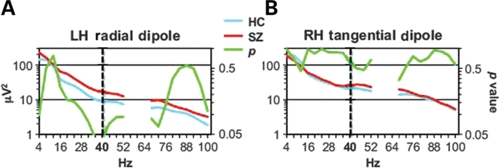
FIGURE 2. Baseline power spectra for the LH radial (A) and RH tangential (B) sources. The HC and SZ spectra are plotted, along with the p values of t-tests of the group difference at each frequency to illustrate the statistical significance of the increased SZ baseline power at 40 Hz. (Due to 60 Hz power line artifact, the frequencies 56–64 Hz were not analyzed.)