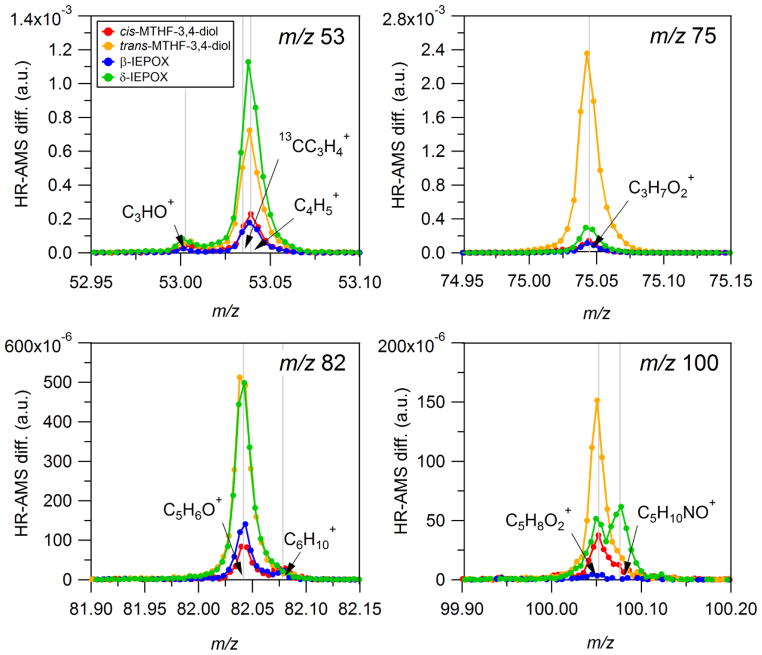
Figure 4.
High-resolution difference spectra of synthesized standards at nominal m/z’s 53, 75, 82, and 100 showing the contributions of various ions. Note that each spectrum has been normalized by the corresponding total mass spectral signal. As a result, values on the y-axis represent fractional contributions to total signal. Overall, the largest contributions at these masses arise from oxidized organic fragments including C3H7O+ (m/z 75), C5H6O+ (m/z 82), and C5H8O2+ (m/z 100). The exception is at m/z 53 where the majority of signal from the reduced fragment C4H5+.

