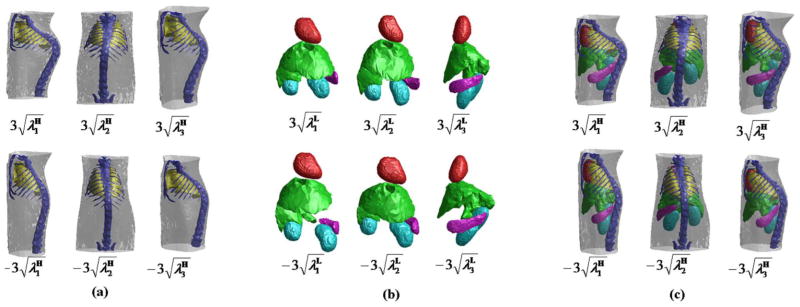
Fig. 2.
Shape variations generated from the statistical shape models and the conditional Gaussian model. (a) First three eigenmodes of the shape variations of SSMH. Each column shows the variation of one eigenmode, varying between (top) and (bottom). (b) First three eigenmodes of the shape variations of SSML, displayed in the same way of (a). (c) First three eigenmodes of the shape variations of SSMH coupled with the correlated variations of SSML estimated using the conditional Gaussian model.

