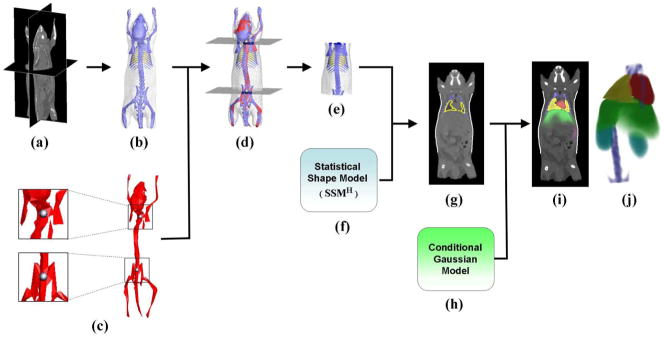
Fig. 3.
(a) Target micro-CT image. (b) High contrast organs segmented from the CT image. (c) Single-subject skeleton atlas used for trunk segmentation. The zoom-in regions show the two landmark points that are used for marking the trunk range. (d) Skeleton atlas registered with the segmented organs. Two axial slices are generated passing through the registered landmarks. (e) Trunk region of the segmented meshes, which is cut out by the two axial slices of (d). (f) Statistical shape model of high contrast organs(SSMH). (g) Result of fitting SSMH to the target subject. (h) Conditional Gaussian model. (i) Probability maps of the registered organs overlaid with the target CT image. (j) Volume rendering of the organ probability maps.

