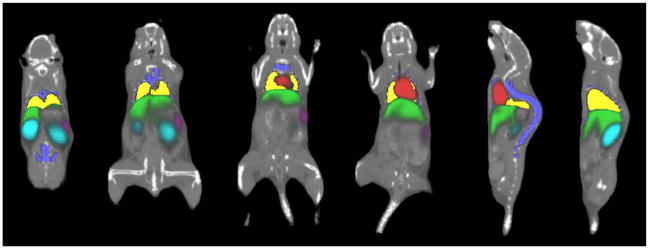
Fig. 4.
Registration result of organ probability maps, overlaid with noncontrast micro-CT images of different subjects. Different coronal and sagittal slices are demonstrated. The probability maps are color-coded. The brightness of color represents the probability value (brighter color means higher probability).

