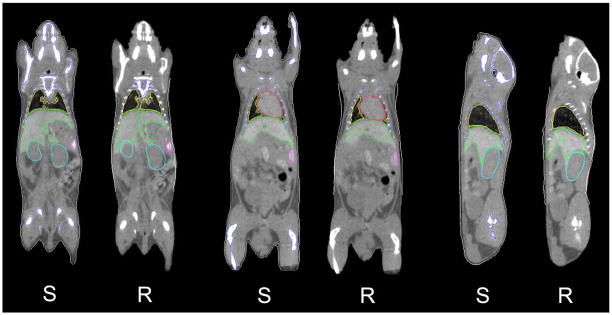
Fig. 5.
Visual comparison of the registration results with human segmentation results, based on contrast-enhanced micro-CT images. For every pair of comparison, “S” stands for human segmentation result, and “R” stands for registration result. The contours of the registration results demonstrate the mean shapes [ and in (7) and (8)] of the registered organs.

