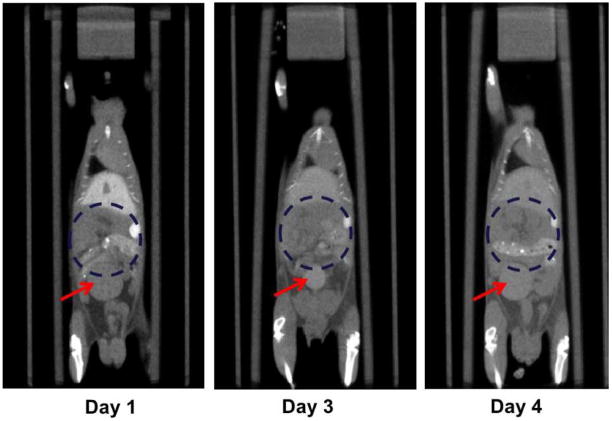
Fig. 9.
Longitudinal micro-CT images of the same subject, demonstrating the instability of bladder position and size, as well as the difficulty of defining the region of the GI track. The subject is shown at similar coronal positions and at different time points after the injection of contrast agent. The red arrows point to the bladder, and the blue dashed circles delineate the rough GI regions. It can also be observed that the GI track has fuzzy boundaries in all images, making it difficult to accurately define it.

