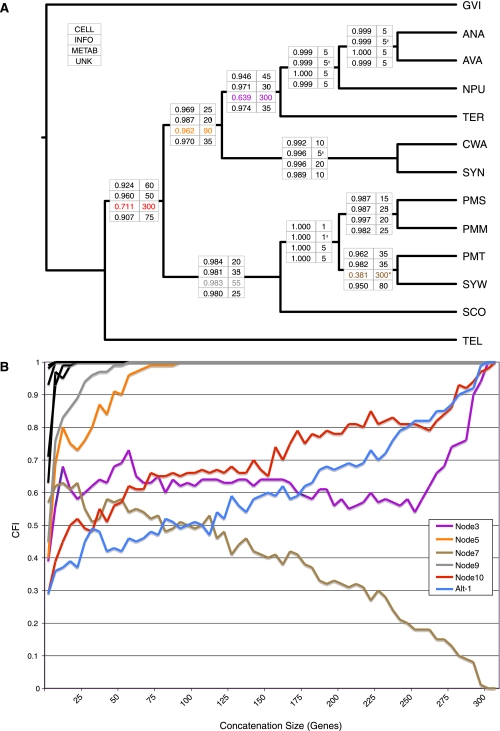
FIG. 4.—
RADICAL analysis of functional subgroups. (A) AUC values (left column) and fixation points (right column) are provided across all T3 nodes for the functional groups cellular processes (CELL), information processing (INFO), metabolism (METAB), and unknown (UNK). AUC values indicate the proportion of total concatenation space occupied by that node and the fixation point indicates the number of genes required before the node appears in all concatenation sets of that size. The asterisk indicates a degradation point, which is defined as the number of genes for which a node no longer occurs in any randomized concatenation set of that size or larger. (B) RADICAL curves for the metabolism genes. Node Alt-1 appears in the ML tree for all the metabolism genes and, therefore, is included in the figure. Only nodes that do not reach fixation in twenty genes or less are distinguished by a colored curve. The other nodes are shown in black.

