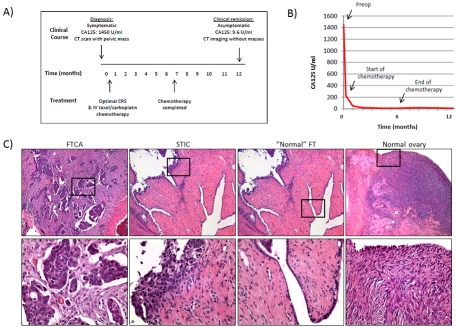
Figure 2.
Clinical and histopathological features of the high grade serous FTCA (P0). (A) An overview of the patient's clinical course and treatment over a 12 month period. (B) A time course of decline in CA125 serum levels over the course of treatment. (C) Representative sections of the histopathology of the FTCA, STIC, adjacent “normal” fallopian tube (FT), and normal ovary, (5X power). Boxed areas shown in lower panels.

