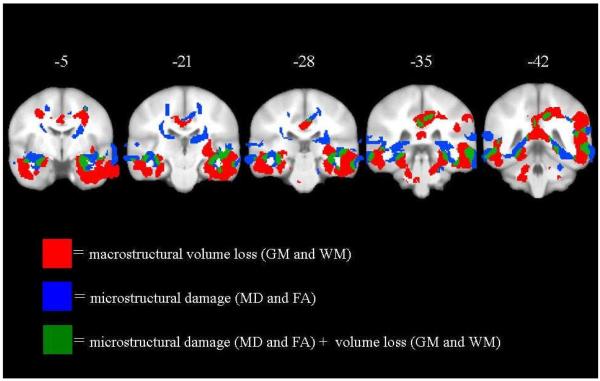
Figure 2.
Coronal slices from Y=−5 to Y=−42 showing regions with higher mean diffusivity (MD) values (’warm’ colors) and lower fractional anisotropy (FA) values (‘cold’ colors) in Alzheimer’s disease (AD) patients compared to controls. The image shows Biolgical Pattern Matching (BPM) analyses of covariance (ANCOVAs) using gray matter (GM) and white matter (WM) images as covariates and ANCOVAs without imaging covariates. Darkened green indicates areas with both FA and MD changes. Contrasts are shown at p<0.001 uncorrected in at least 50 edge connected voxels. Color bars denote t-values.

