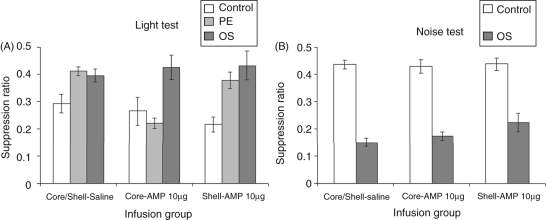
Figure 6.
(A) Mean suppression ratio (±SEM) to the light for control (white bars), pre-exposed (light grey bars) and overshadowing (dark grey bars) groups following injection of vehicle or 10.0 µg amphetamine in either the core or shell subregions of the nucleus accumbens. (B) Mean suppression ratio (±SEM) to the noise for control (white bars), pre-exposed (light grey) and overshadowing (dark grey bars) groups following injection of vehicle or 10.0 µg amphetamine in either the core or shell subregions of the nucleus accumbens.

