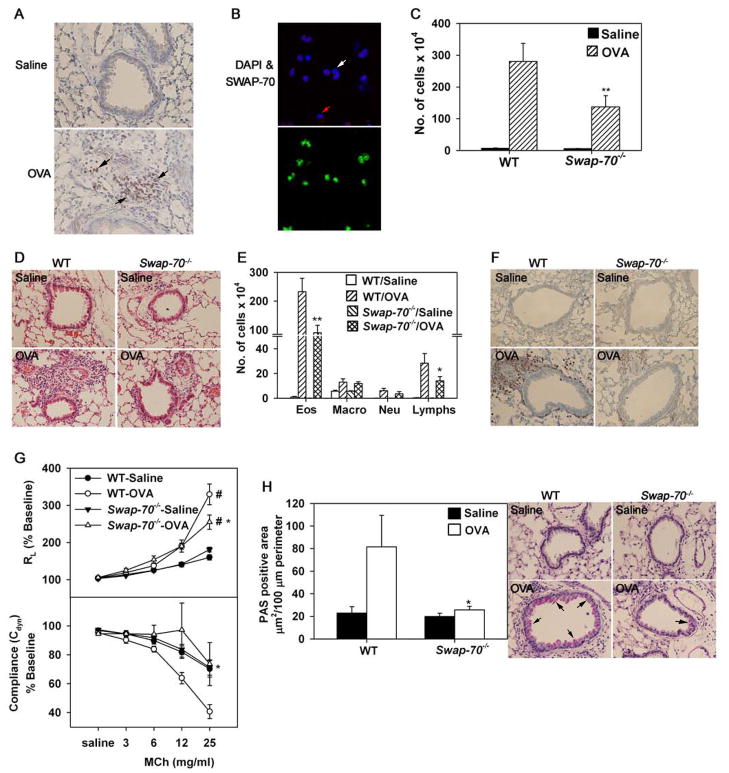
Fig 6. Allergen-induced airway inflammation is attenuated in Swap-70−/− mice.
(A) Immunohistology of paraffin embedded lung sections from saline and allergen (OVA)-challenged WT mice with polyclonal antibodies against murine SWAP-70. Black arrows in lung sections of allergen-challenged mice indicate cells positive for SWAP-70. Magnification ×200. (B) Immunofluorescence staining of BALF cells from allergen-challenged WT mice with polyclonal antibodies against SWAP-70 (upper panel) and rat mAb against murine MBP (lower panel) followed by rhodamine-conjugated goat anti-rabbit IgG and FITC-conjugated goat anti-rat IgG, respectively. Images of the same field with and without DAPI staining are shown. White arrows indicate cells in BALF that are negative for both SWAP-70 and MBP expression, while red arrows indicate cells that are positive for SWAP-70 but negative for MBP expression. Magnification ×600. Representative images are shown for A and B. (C) Total cell counts in BALF from saline and OVA-challenged WT and Swap-70−/− mice. (D) Cellular infiltration of lungs after H&E staining of paraffin embedded lung sections. Representative images (magnification ×100) are shown. (E) Differential cell counts in BALF from saline and OVA-challenged WT and Swap-70−/− mice. Combined data from experiments repeated at least three times is shown for C and E. n = 11 mice for saline groups and 15 mice for OVA-challenged groups. (F) Infiltration of lung tissue by eosinophils after staining with rat mAb against murine MBP. Representative images (magnification ×200) are shown for saline and allergen-challenged groups. (F) Pulmonary resistance and compliance measured in saline and OVA-challenged WT and Swap-70−/− mice by invasive plethysmography after exposure to increasing concentrations of aerosolized methacholine (MCh). Combined data of three experiments is shown. n = 7–9 per group. (G) Mucus production in airways after PAS staining. PAS-positive area in airways of relatively similar size (3–12 airways/slide) was quantitated by ImageJ analysis of captured images (left). Representative images (magnification ×200) are shown for saline and allergen-challenged groups (right). For A and B, n = 5 mice per group and for D, F and H, n = 9 mice per group. Data represent mean ± SEM in C, E, G and H (left panel). *p < 0.05 and **p < 0.02 for allergen-challenged Swap-70−/− versus WT mice. #p < 0.01 for allergen-challenged group versus respective saline group.

