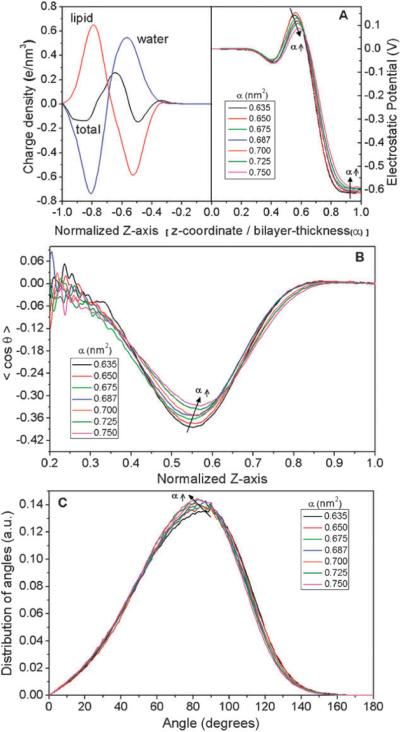
Fig. 3.
(A) Charge density profile of the lipid bilayer is shown on the left, including the contributions from lipid and water. On the right are the respective electrostatic potential profiles as a function of area-per-lipid. (B) Ordering of water dipoles with respect to bilayer normal at different area-per-lipid. (C) Angular distribution of DPPC P–N vector with respect to the normal of the bilayer. In (A) and (B) the abscissa is normalized by the size of the simulation box for each α, and only half of the simulation box is shown, due to symmetry (z = 0 denotes the center of the bilayer).

