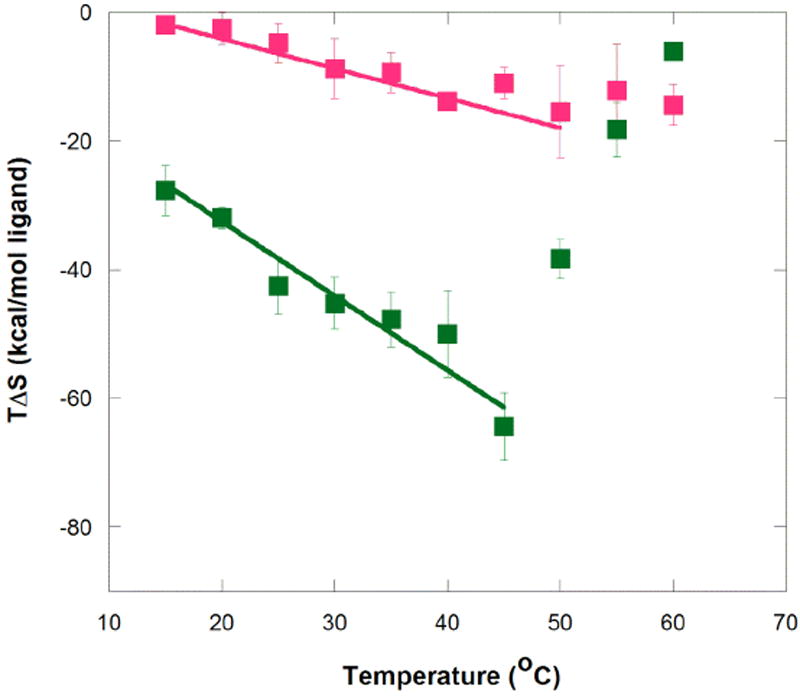
Figure 4.

Temperature dependence of entropy for aptamer binding to MG and TMR. Symbols represent average TΔS° values at each temperature for MG (green) and TMR (magenta). Error bars are from the standard error of the mean. Buffer conditions were 10 mM sodium cacodylate (pH 5.8), 10 mM KCl, and 10 mM MgCl2. Slope of the fits here is equal to ΔCp + ΔS, which is ~ΔCp because ΔS is relatively small. The slope of this plot is not interpreted in detail herein because ΔCp is directly obtainable in Figure 3 and ΔS is available in Tables 1 and 2. Nonetheless, this plot provides the trend of TΔS° with temperature.
