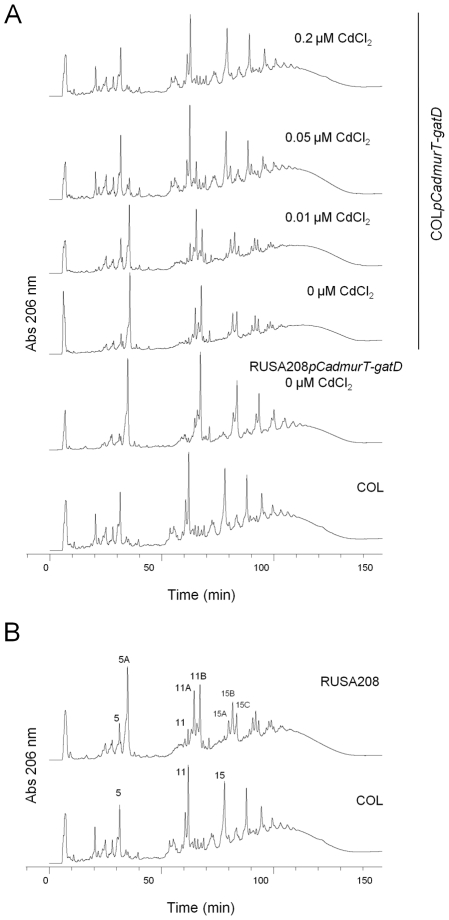
Figure 3. RP-HPLC cell wall profiles.
The purified peptidoglycan was digested with mutanolysin, reduced and analyzed by RP-HPLC. (A) muropeptide profiles of strains COL, RUSA208pCadmurT-gatD, grown without CdCl2, and COLpCadmurT-gatD grown with 0, 0.01, 0.05 and 0.2 µM of CdCl2. (B) muropetide profiles of strains COL, RUSA208. The muropeptide structures corresponding to peaks 5, 5A, 11, 11A, 11B, 15, 15A, 15B and 15C were inferred from mass spectrometric analysis (4).

