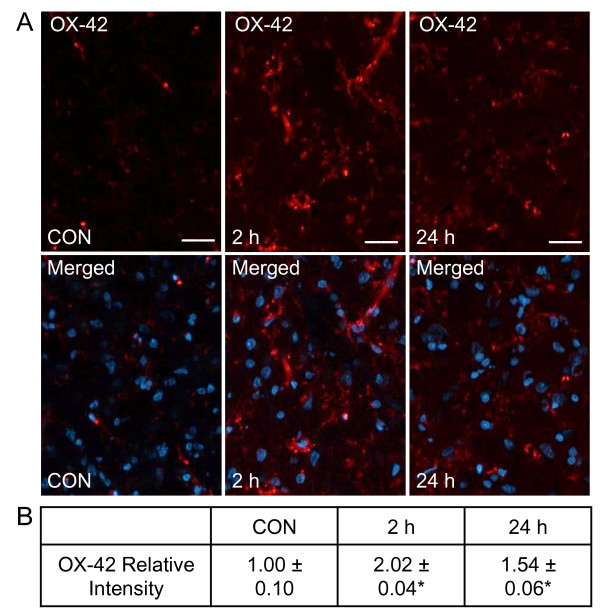
Figure 6.
Elevated expression of OX-42 in microglia. Sections of spinal cord were obtained from control animals (CON), animals 2 hours post CGRP injections, or animals 24 hours post CGRP injection. (A) Images of spinal cord tissues stained for OX-42 are shown in the top panels. Magnification bar = 50 μm. The same sections costained for OX-42 and DAPI are shown in the bottom panels. (B) The average fold change ± SEM of OX-42 staining intensity from control values is reported (n = 3). * P < 0.05 when compared to control values.

