
Figure 2.
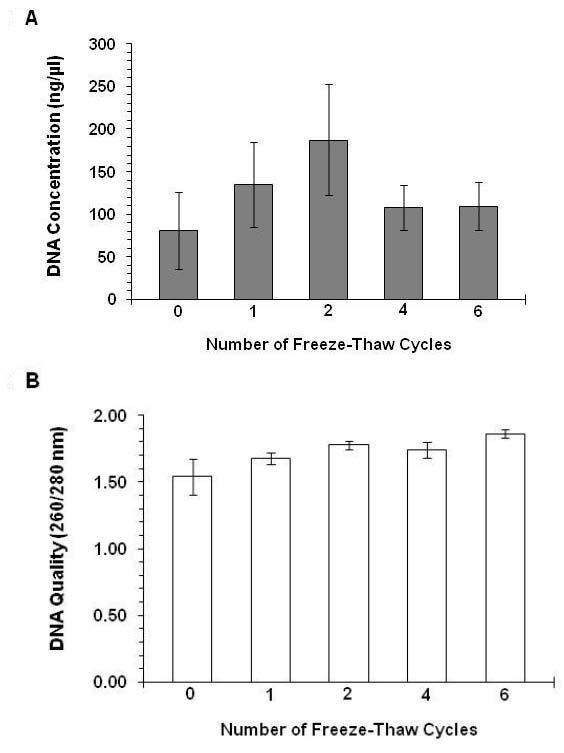
Study 4 "Freeze-Thaw Effects" concentration (Figure 2A) and quality (Figure 2B) measures of salivary DNA obtained from passive drool. Saliva samples exposed to 0, 1, 2, 4, and 6 freeze-thaw cycles. Note: .50 ml of whole saliva was used in each condition. Error bars represent the standard error.