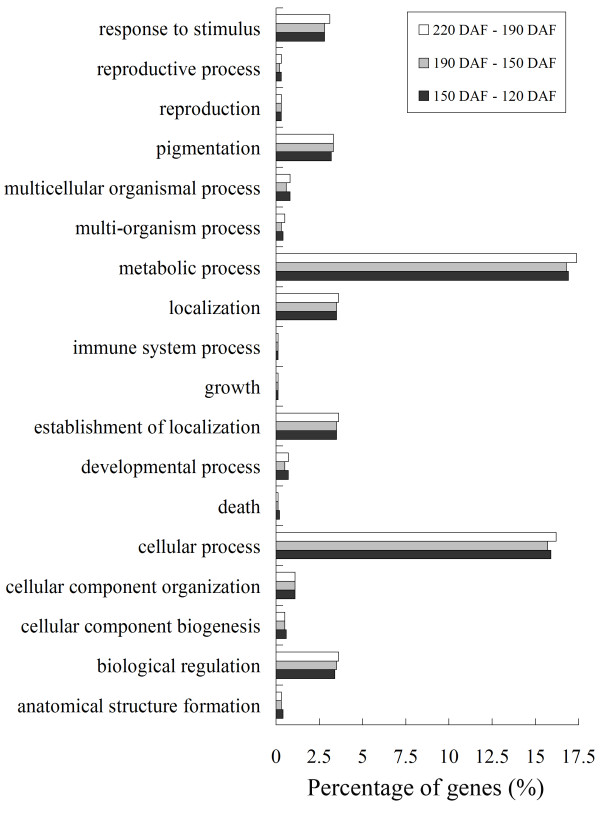
Figure 2.
Functional categorization of genes differentially expressed during fruit development and ripening in 'Anliu' sweet orange based on biological process of Gene Ontology. The differences between 120 and 150 DAF are indicated by black squares. The differences between 150 and 190 DAF are indicated by light grey squares. The differences between 190 and 220 DAF are indicated by white squares. Percentages are based on the proportion of the number of genes in each set.

