
Figure 2.
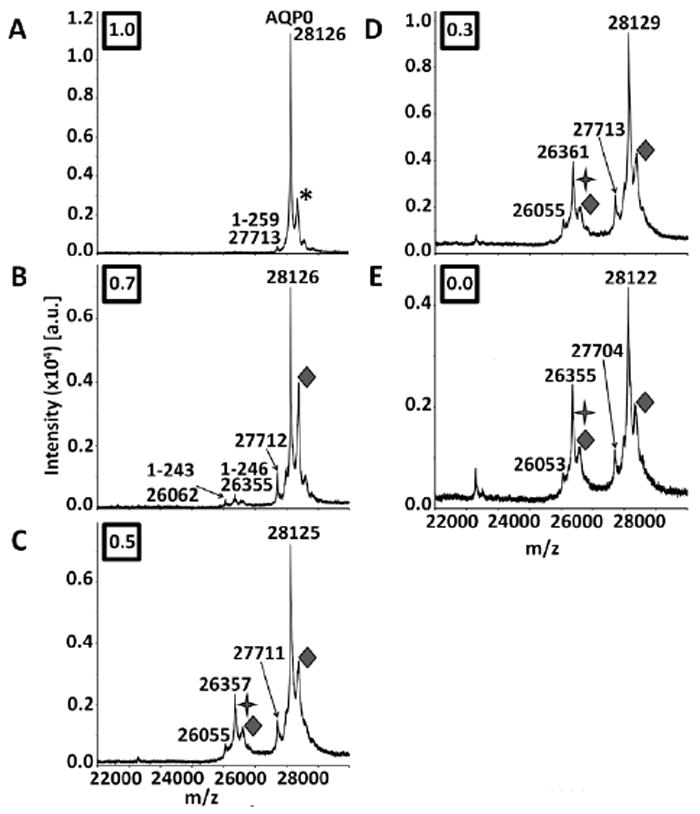
MALDI tissue profiles of 7 year human lens sections acquired at normalized lens distances of A) 1.0, B) 0.7, C) 0.5, D) 0.3, and E) 0.0. The diamonds (◆) indicate oleoylation of AQPO (+ 264 Da), which appears beginning at a normalized lens distance of 0.7. The stars (
 ) indicate acetylation (+ 42 Da), which appears as small shoulder peaks to AQP0 1-246 peaks (indicated by m/z labels) beginning at a normalized lens distance of 0.5. The AQP0 label represents full length AQP0 (AQP0 1-263). AQP0 truncation products are represented by 1-x, where x is the C-terminal residue. The asterisk represents a sinapinic acid adduct. Boxed numbers represent the normalized lens distance from which the spectrum was obtained.