
Figure 4.
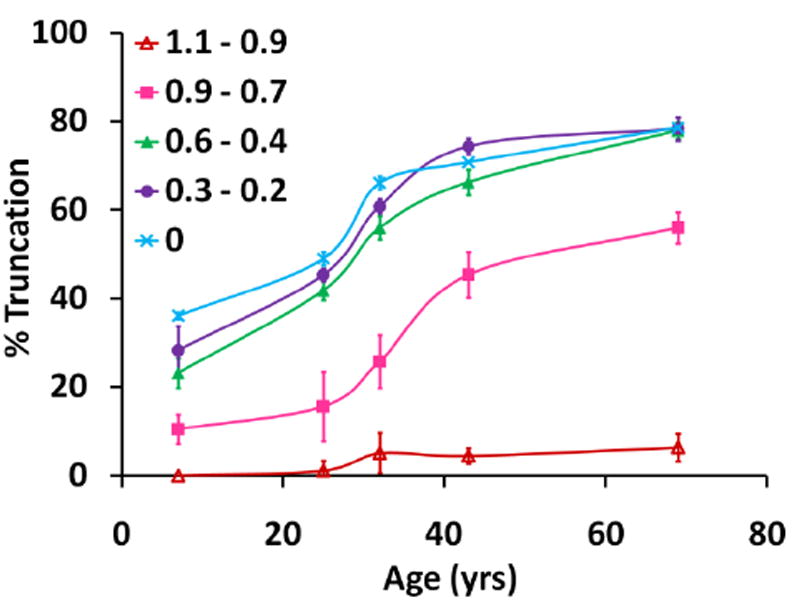
The distribution of truncated AQP0 1-246 as a function of lens age. For each age, the percent of truncation was determined in five regions across the lens, defined by the estimated radial distance (normalized to the lens radius) spanned by each region. The percent of truncation was calculated using the peak intensity (peak height) of truncated AQP0 compared to the total intensity for truncated AQP0 1-246 and intact AQP0.